Campaign layout ideas.
Design - Campaign.pdf
Sunday, April 27, 2008
Saturday, April 26, 2008
NextWar - Faction Design
A very preliminary document outlining some of the units, structures and upgrades available to each faction. It's probably going to be changed a lot once I actually get the game done and the factions need to be balanced.
Design - Factions.pdf
Design - Factions.pdf
Friday, April 25, 2008
NextWar - Plot Outline
Next up is a summary of the plot and backstory behind each faction.
NextWar: The Quest for Earth
Design - Plot Outline.pdf
NextWar: The Quest for Earth
Design - Plot Outline.pdf
Thursday, April 24, 2008
Optimising the NextWar loader - why Xml.Serialization is so slow
One of the core design goals of NextWar is that it should function much like a casual game. That means that it needs to satisfy a some criteria for what a user should expect from a casual game. One of these criteria is that it must start and load quickly. Long load times prohibit the "just start and play" factor that you should be able to expect from a casual game.
This was a problem I initially encountered with NextWar. NextWar was designed to be incredibly data-driven. One of the earliest design choices I made was to use an XML-based content definition system for definition practically every aspect of the game. XML-based approaches have been very successful in other games, such as Command and Conquer 3 and Civilization 4. XML is particularly convenient for me because I'm using C# - and as such have access to the massive .NET BCL. One of the most useful set of classes I've found were in Xml.Serialization. Xml.Serialization has the ability to automatically load an XML file and deserialise it into a user-defined class. It also operates in reverse; it can serialise any user type into an XML format. This is useful for things like settings and save games.
When I wrote SCALE, one of the major challenges I faced was this same issue of deserialisation - once I got the data from the file, how did I get it into the data structure? C++ has no automated facilities for this - in the end I resorted to an incredibly long and verbose manual method of copying raw data into specified data members.
Using the power of bytecode, .NET is able to automate the entire process. Seriously, deserialising an XML file takes about 10 lines of code. But, like all things, there is a price to pay for this convenience. Even though I have a very small amount of data (currently about 125KB of XML data), parsing and deserialisation took about 4.5 seconds on a relatively high end 2.8ghz Core 2 Duo. This was insanity - and I knew in advance that I was going to have a LOT more than 125kb of XML by the time I finished the game. The problem was also that all the time was spent in the core .NET libraries themselves - profiling revealed that my code was lightning-fast. The culprit was, unexpectedly enough, Xml.Serialization.
After a lot of in-depth research into the issue, what makes Xml.Serialization so damn slow? The main reason has nothing to do with data conversions, or parsing, or anything like that. The reason is that Xml.Serialization needs to go through a long (and extremely expensive) process to generate the necessary metadata to load the data into your class.
Here's what Xml.Serialization does. It uses the .NET reflection libraries (which, by themselves, are already incredibly slow) to look into the assembly bytecode for the class that you're trying to deserialise. Then, it generates new bytecode from this class so that it can serialise/deserialise each of the data members. In short, it generates a serialiser or deserialiser class on the fly. Once it generates the bytecode for the class, it then compiles that bytecode into a DLL assembly, which is then loaded by the .NET runtime. The .NET JIT1 (just-in-time) compiler then compiles this code and executes it.
All of this is, understandably, extremely slow. Generating an assembly like this could take hundreds of milliseconds for each type. And I know that Xml.Serialization is actually doing this; the Visual Studio debugger confirmed it. But what to do about it?
Well, as it turns out, Microsoft provides a tool with the Visual Studio SDK called SGEN. SGEN does exactly what Xml.Serialization does - except that instead of loading and using the generated DLL, it saves it to file. Thus, it is a tool to pre-generate the serialisers/deserialisers into a DLL which can then be loaded and used directly, rather than letting Xml.Serialization do it at load time.
After a bit of fiddling, I got SGEN to work, and I linked my program against it to use the deserialisers. And lo and behold, my load time was cut in half. Deserialising XML files is now lighting fast, thanks to this handy little tool.
1 It's a common misconception that .NET code is bytecode-interpreted. Such a thing might be fine for a simple scripting language, but would be far too slow for something like .NET. Rather, the .NET runtime includes a Just-In-Time compiler (often referred to as the "JIT"). When the program loads, the JIT reads the bytecode and dynamically compiles it into native assembly instructions. Then, this native assembly is executed directly by the CPU. The nature of the JIT, and the fact that it needs to be done at runtime, means that the assembly code will be nowhere near as fast as an off-line optimising C++ compiler, for example. The JIT is designed to run fast, but it's still not a good idea to be invoking it unless really needed. And in this case of Xml.Serialization, it was certainly not needed.
Friday, April 18, 2008
NextWar: The Quest for Earth
"NextWar" is such a nice generic name, isn't it?
Well, it's pretty much official now. I've joined the SwinGame game competition.
SwinGame
SwinGame is an API written by the staff and students of Swinburne University, based here in Melbourne, Australia. Swinburne is also backing the SwinGame 08 Competition - where Australian Year 11 and Year 12 students can participate in a competition to create the best overall game using the SwinGame API.
The grand prize is $3000 for the author of the game. Second prize is $2000 and third prize is $1000.
Since I happen to be an Australian student currently studying in Year 12, I'm entering this contest. Hopefully, come August this year, I'll be walking away with $3000.
NextWar
NextWar is what I decided to name my game. It came to me while sitting on the train, which is where I also formulated the basic game mechanics and plot structure. NextWar's full name is "NextWar: The Quest for Earth". It's going to be a 2D RTS game, written in C# and using the SwinGame API.
For more information, I'll be posting progress reports here, as well as here to this blog.
So far, I've got the basic framework for the game done; gamestate management and GUI are all complete, as well as the asset loading system and basic renderer.
Also, I've been doing some design for the actual game itself. I've been writing some documents for my own personal use regarding the design of the game. I decided to post them here; they're not very interesting and not particularly well done, but they function as an effective brain-dump for ideas. And it couldn't hurt to post them online. I never intended for them to be seen by anyone other than me, so sorry if they don't make much sense.
So, without further ado, the first in a series of documents I'll be posting:
NextWar: The Quest for Earth
Design - Basic Overview & Gameplay
Thursday, April 3, 2008
Optimising the Vertex Welder: Adventures Into Spatial Partitioning
Vertex welding is simply an optimisation technique to reduce the number of vertices sent to the graphics hardware. It's very simple: if there there are two vertices which are very close to each other, then the two vertices are "welded" into a single vertex. Since the vertices were so close together in the first place, nobody ever notices and we just saved ourselves a vertex.
Really, vertex welding is just a specialised form of collision detection. Each vertex needs to be checked against every other vertex to see if they're close together or not (and welded if they are). As such, a naive implementation runs in O(n^2) (or worse) time.
The first vertex welder I wrote was, well, slow. Welding a ~22,000 vertex mesh took over 12 seconds, and welding a smaller ~2300 vertex mesh took about 300ms. This was a completely unacceptable running time, as meshes are expected to run in the range of tens of thousands of vertices and a multi-minute loading time would be pure insanity.
That vertex welder was a very simple implementation: for each vertex, search every other vertex and weld if needed. If a weld occurred, then scan through the index buffer and make the necessary corrections. At worst, this algorithm ran in O(n^3) time, because it would need to loop through the index buffer each time a vertex was welded (and the index buffer's size for a freshly loaded COLLADA mesh is directly proportional to vertex count). At best, it was O(n^2).
I dumped that code and rewrote it from scratch, trading more memory usage for a better running time. I kept buffers which mapped vertices to welded vertices, and used this in a final, single loop over the index buffer to correct the indices. This brought the running time down to O((n^2+n)/2) (rather than between O(n^2) and O(n^3) like the old code). This dramatically improved running time: that 22,000 vertex mesh that took 12 seconds to load on the old code? 1.9 seconds on the new code.
Running the code through a profiler revealed a few performance hotspots. At the top of the list was an incredibly expensive square root that was being used in the distance calculations. Factoring out the square root and making some misc. performance changes increased the performance by a factor of 4.
But the algorithm was still too slow, O((n^2+n)/2) wasn't good enough. I needed to see if it would be possible to get it any faster. Rather than pine over micro optimisations in the code I had, I instead looked for a high-level algorithmic change.
The most common optimisation for dumb collision detection is spatial partitioning. Spatial partitioning involves splitting up the entities into groups based on their position. There are many constructs to achieve this, such as BSP trees and kd-trees.
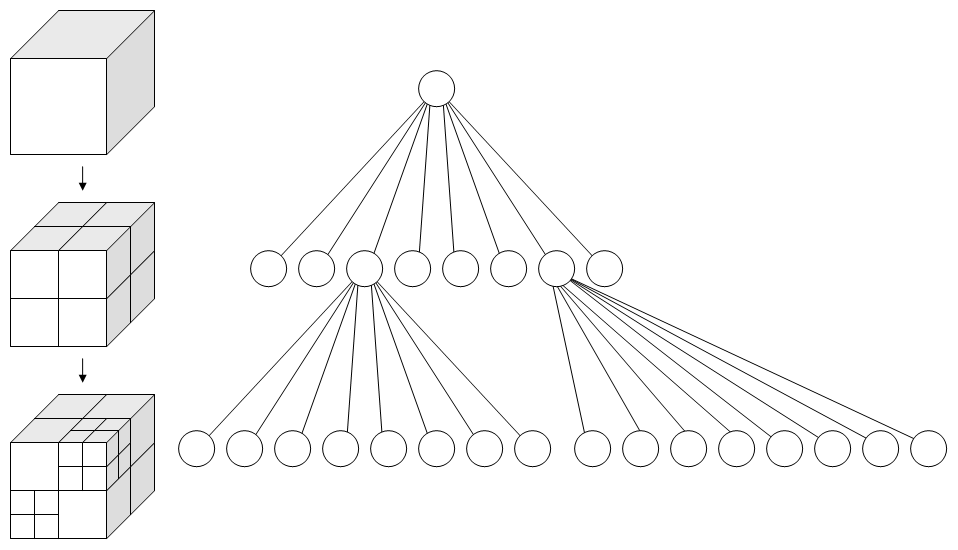
I chose to use an octree. Octrees are a special case of kd-trees. Specifically, octrees are 3-dimensional kd-trees (and quadtrees are 2-dimensional kd-trees). Octrees are simple: divide up the search space into 8, equally sized, "octants". Each octant represents an eighth of the volume of the search space. Then for each octant, recursively split it into smaller and smaller octants until a desired limit is reached.
This diagram, courtesy of wikipedia, demonstrates nicely:

After the octree is constructed and all the vertices are divided into neat little groups based on spatial position, the welding can begin. Welding the mesh then simply consists of going through each octant in the octree, and welding the octant's vertices. Since the number of vertices in each octant is much smaller than the original, the welding is done much faster.
Usage of an octree reduces the time complexity from O(n^2) to average O(m(n / m)^2), where n is the total number of vertices and m is the total number of partitions in the octree. This can be simplified down to simply O(n^2/m). But what to choose for m? In other words, how many partitions should we create in the octree?
I chose a value of (sqrt(n) / 4). Why? No idea. It's a magic number, and it worked reasonably well. sqrt(n) would mean that the average number of vertices in each partition would be equal to the number of partitions. But the more partitions you create, the more overhead the octree has. But if you have too few partitions, the welding's going to take too long for each partition. It's a fine balance, and sqrt(n) / 4 seemed to work well.
This means that, when using the octree, the vertex welding algorithm is not quite O(n) linear time, but it's certainly a lot better than O(n^2). Here are the benchmark times:
As you can see, using the octree has resulted in a very significant improvement in speed. Completely welding a 100,000 vertex sphere now takes only 686ms compared to 489484ms, which is in excess of a 700x improvement in speed.
Really, vertex welding is just a specialised form of collision detection. Each vertex needs to be checked against every other vertex to see if they're close together or not (and welded if they are). As such, a naive implementation runs in O(n^2) (or worse) time.
The first vertex welder I wrote was, well, slow. Welding a ~22,000 vertex mesh took over 12 seconds, and welding a smaller ~2300 vertex mesh took about 300ms. This was a completely unacceptable running time, as meshes are expected to run in the range of tens of thousands of vertices and a multi-minute loading time would be pure insanity.
That vertex welder was a very simple implementation: for each vertex, search every other vertex and weld if needed. If a weld occurred, then scan through the index buffer and make the necessary corrections. At worst, this algorithm ran in O(n^3) time, because it would need to loop through the index buffer each time a vertex was welded (and the index buffer's size for a freshly loaded COLLADA mesh is directly proportional to vertex count). At best, it was O(n^2).
I dumped that code and rewrote it from scratch, trading more memory usage for a better running time. I kept buffers which mapped vertices to welded vertices, and used this in a final, single loop over the index buffer to correct the indices. This brought the running time down to O((n^2+n)/2) (rather than between O(n^2) and O(n^3) like the old code). This dramatically improved running time: that 22,000 vertex mesh that took 12 seconds to load on the old code? 1.9 seconds on the new code.
Running the code through a profiler revealed a few performance hotspots. At the top of the list was an incredibly expensive square root that was being used in the distance calculations. Factoring out the square root and making some misc. performance changes increased the performance by a factor of 4.
But the algorithm was still too slow, O((n^2+n)/2) wasn't good enough. I needed to see if it would be possible to get it any faster. Rather than pine over micro optimisations in the code I had, I instead looked for a high-level algorithmic change.
The most common optimisation for dumb collision detection is spatial partitioning. Spatial partitioning involves splitting up the entities into groups based on their position. There are many constructs to achieve this, such as BSP trees and kd-trees.
I chose to use an octree. Octrees are a special case of kd-trees. Specifically, octrees are 3-dimensional kd-trees (and quadtrees are 2-dimensional kd-trees). Octrees are simple: divide up the search space into 8, equally sized, "octants". Each octant represents an eighth of the volume of the search space. Then for each octant, recursively split it into smaller and smaller octants until a desired limit is reached.
This diagram, courtesy of wikipedia, demonstrates nicely:
After the octree is constructed and all the vertices are divided into neat little groups based on spatial position, the welding can begin. Welding the mesh then simply consists of going through each octant in the octree, and welding the octant's vertices. Since the number of vertices in each octant is much smaller than the original, the welding is done much faster.
Usage of an octree reduces the time complexity from O(n^2) to average O(m(n / m)^2), where n is the total number of vertices and m is the total number of partitions in the octree. This can be simplified down to simply O(n^2/m). But what to choose for m? In other words, how many partitions should we create in the octree?
I chose a value of (sqrt(n) / 4). Why? No idea. It's a magic number, and it worked reasonably well. sqrt(n) would mean that the average number of vertices in each partition would be equal to the number of partitions. But the more partitions you create, the more overhead the octree has. But if you have too few partitions, the welding's going to take too long for each partition. It's a fine balance, and sqrt(n) / 4 seemed to work well.
This means that, when using the octree, the vertex welding algorithm is not quite O(n) linear time, but it's certainly a lot better than O(n^2). Here are the benchmark times:
~2,000 Vertex Ducky:
Original: 306ms
Profiled + Reoptimised + Octree: [Too fast to measure]
~12,000 Vertex Torus
Profiled + Reoptimised: 4181ms
Profiled + Reoptimised + Octree: 46ms
~22,000 Vertex Lunar Rover:
Original: 12768ms
Optimised: 1966ms
Profiled + Reoptimised: 468ms
Profiled + Reoptimised + Octree: 47ms
100,000 Vertex Sphere:
Profiled + Reoptimised: 489484ms
Profiled + Reoptimised + Octree: 686ms
As you can see, using the octree has resulted in a very significant improvement in speed. Completely welding a 100,000 vertex sphere now takes only 686ms compared to 489484ms, which is in excess of a 700x improvement in speed.
Wednesday, April 2, 2008
Debugging Horrors: The case of the rogue #pragma pack
Here's a tale of horrors of #pragma pack. I already posted quite a bit about the issue over on that thread at GameDev.Net, so I won't bother reposting it here. It's an interesting read into solving a particular, very strange, bug.
The gist of the issue was that I forgot to disable a particular #pragma pack in one of my headers - causing the packing rules to propogate down into the FCollada header files. Because of this, the compiler got the padding and offsets wrong, which resulted in corrupted this pointers all over the place.
It was, by far, my most harrowing debugging experience. However, it was an experience not to be forgotten. And it was an excellent showcase for Visual Studio's amazing debugging capabilities. I'm not kidding here; Visual Studio has the best and easiest to use debugger ever. Period. I really doubt I could have resolved this bug without the awesome debugger in VS.
But, my crashing problems were still not resolved. Even after I fixed that rogue #pragma pack, the code ran fine in Debug mode. But crashed in Release mode. Since I couldn't really use the debugger in release mode, I had no idea what was going on. The capabilities of the debugger are castrated in release mode, since release mode is supposed to be for final production-level code, and has no debugging facilities.
All I knew was that the crash was occurring even before WinMain() was hit. Which meant that something funky was going on. The debugger did still help, even though was in release mode. The code that was causing the crash was a static variable in one of FCollada's classes: a tree class of some sort.
A quick look at the code in the tree class revealed this little fact: the constructor of the tree class allocated some memory through a global memory handler. The global memory handler was just a global variable, a function pointer, that was initialised to malloc/free. Whenever an allocation was made, this function pointer would be used to allocate memory.
Experienced programmers should see the bug. It's a very subtle way to crash your program, and is difficult to track down. It's known as the Static Initialisation Order Fiasco. Global variables do not have a defined order of initialisation in C++ - it all depends on how the compiler was feeling that day. In other words, initialisation order is effectively random.
So what was actually happening? Well, the global tree variable was being initialised before the memory manager was. That meant that in the constructor for the tree, it was trying to allocate some memory. But since the memory manager hadn't even been initialised yet, the entire program crashed before it had even hit main()!
Up to this point, everyone had just gotten lucky. The compiler had, for some reason, decided to always intitialise the memory manager first. So the memory manager was initialised and ready to go by the time the tree was constructed. But when I recompiled the code, my compiler decided to do it in the reverse order which crashed the program with a difficult-to-detect bug.
This is one of the things that makes globals so damn dangerous - the static initialisation order fiasco gives your program a 50/50 percent chance of dying. And it's random. As the C++ FAQ Lite deftly noted, it's like playing russian roulette with half the chambers loaded.
Needless to say, I left a post informing the developers about it and posted a fix. FCollada is no longer managed by Feeling Software; they relegated the responsibility to the open source community. It remains to be seen whether they'll actually fix this bug, but I'm not hopeful. In the meantime, I've fixed the bug on my local copy of the source code, and now my COLLADA loader is working fine.
Stay tuned for next time: Optimising the mesh loader.
Subscribe to:
Posts (Atom)